Supporting teachers to diagnose and deal with students’ statistical misinterpretations
Innovative teacher training with eye-tracking vignettes.
The importance of data literacy
Statistically literate students are essential in today’s data-driven society. To foster this, mathematics education must equip learners with the data literacy skills to critically interpret and reflect on statistical graphs—such as histograms, boxplots, case-value plots, and dotplots. However, many students struggle with these visual representations and the conclusions they imply. The Eye-Teach-Stats project aims to supports preservice and in-service mathematics teachers in recognizing and addressing students’ misinterpretations of statistical graphs.
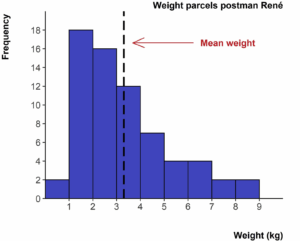
Histogram
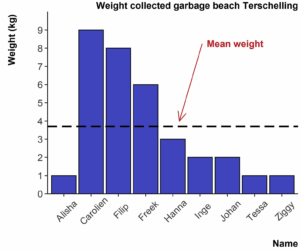
Case-value plot
Source: Boels, L., Bakker, A., Van Dooren, W., & Drijvers, P. (2019). Conceptual difficulties when interpreting histograms: A review. Educational Research Review, 28, 100291.
Training Course for Teaching Statistical Graphs
In the Eye-Teach-Stats project, we are developing a research-based course with four modules focused on dotplots, boxplots, histograms, and case-value plots. Using eye-tracking vignettes, teachers gain insight into how students interpret graphs—spotting misconceptions and refining their own strategies. This innovative approach strengthens educators’ statistical knowledge and teaching skills, helping them guide learners toward clearer, more critical data understanding.