Eye tracking data can be visualized in different ways, such as gaze plots, heat maps and gaze videos. Each technique highlights unique aspects of how people look and interact.
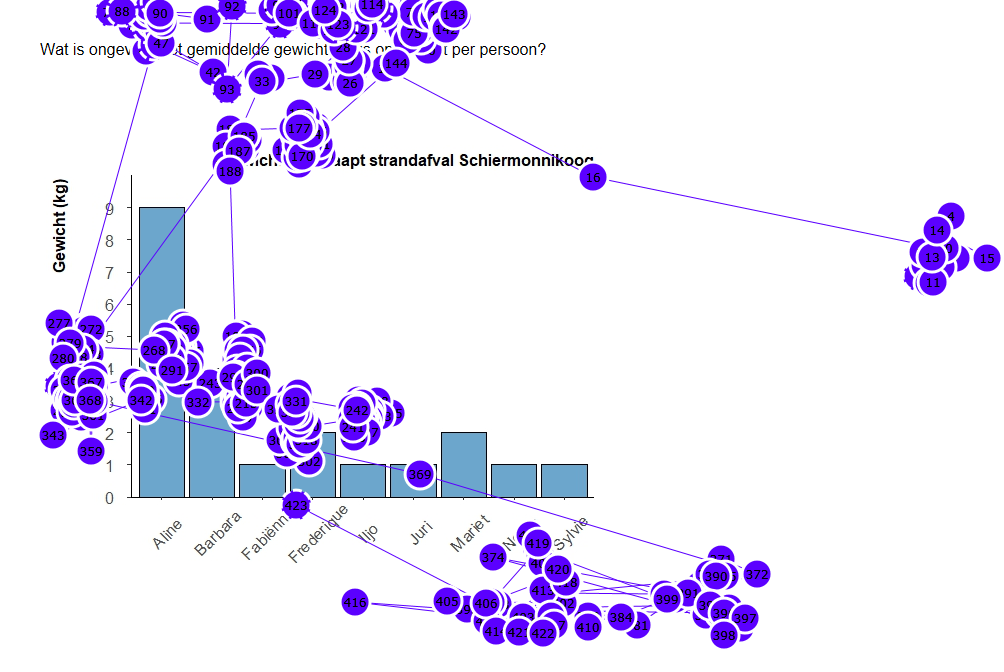
dot = fixation
line = saccade
Gaze Plot
In a gaze plot, gaze data collected from eye-tracking devices is superimposed onto the original stimulus, creating a combined view of both the stimulus and the participants’ eye movements.
The visualization includes dots and lines representing fixations and saccades, respectively. Fixations are depicted as dots, with each dot indicating a phase when the participant’s gaze remains relatively stable on a specific area of the stimulus. The size of the dot typically corresponds to the duration of the fixation, with larger dots representing longer durations of fixation.
Saccades, on the other hand, are represented by lines connecting two consecutive fixations. These lines indicate rapid eye movements between different areas of the stimulus.
Gaze Video
In a gaze video, gaze data collected from eye-tracking devices is superimposed onto the original stimulus, creating a combined view of both the stimulus and the participants’ eye movements.
The visualization includes dots representing fixations. Each dot indicating a moment when the participant’s gaze remains relatively stable on a specific area of the stimulus.
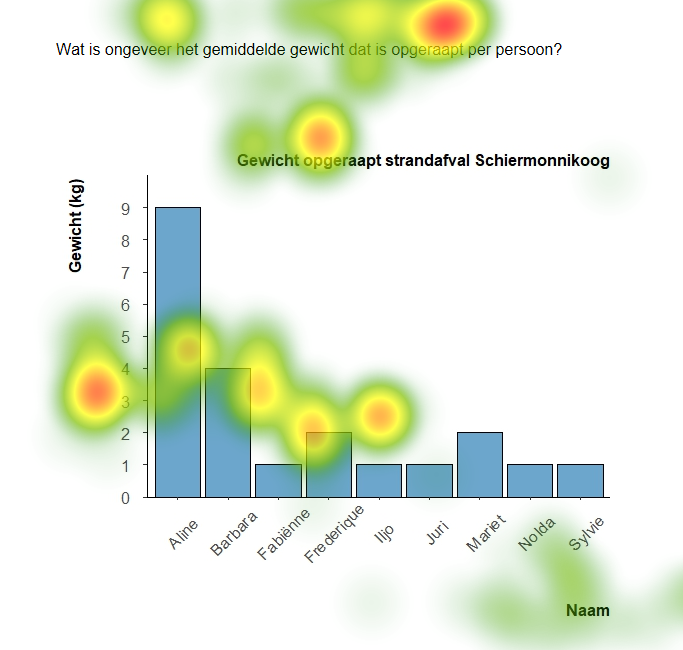
red = area viewed longer
Heat Map
In heat maps, gaze data captured by eye-tracking devices is superimposed on the original stimulus to create a combined view of both the stimulus and the participants’ gaze data.
The visualization shows colored areas that represent fixations or saccades. The distribution of fixations, in which the participant remains relatively stable on an area of the stimulus, is indicated by the coloring. The redder and brighter the colors are, the longer this area is viewed.