The 4C/ID model
In the Eye Teach Stats project, we use the Four-Component Instructional Design (4C/ID) model as a foundation for designing eye-tracking vignettes.
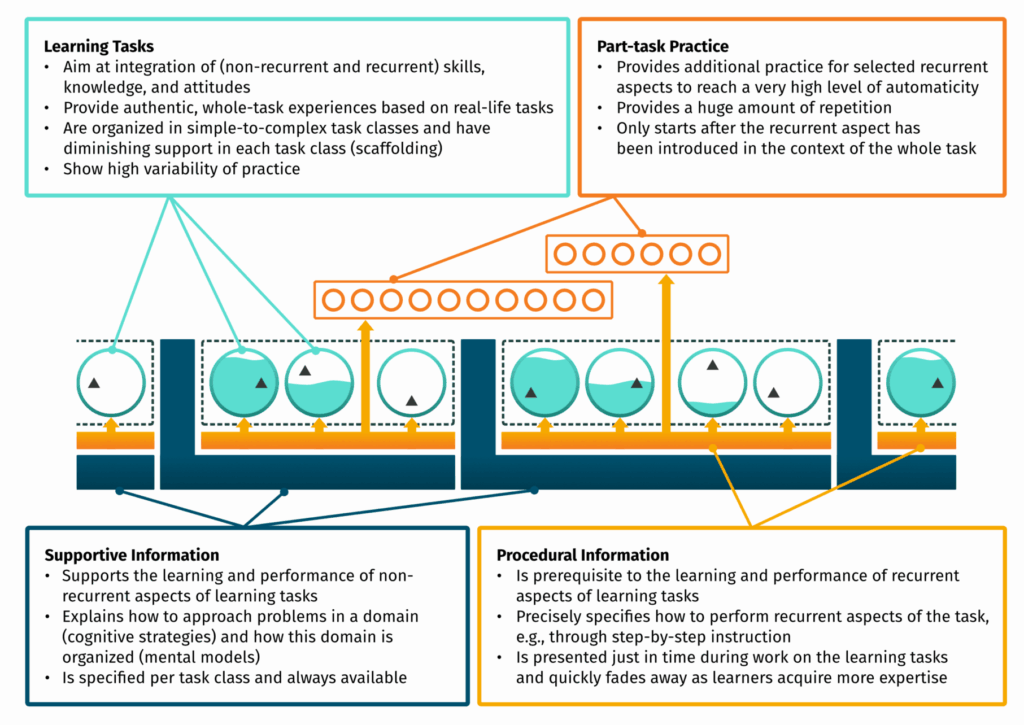
The 4C/ID model was developed to guide the instructional design of educational programs aimed at teaching complex skills or professional competencies (Van Merriënboer et al., 2002; Van Merriënboer & Kirschner, 2018).
It identifies four key components, namely: learning tasks, supportive information, procedural information, and part-task practice.
How is each 4C/ID component used while designing eye-tracking vignettes?
Learning Tasks
In each vignette, teachers are placed in a realistic classroom scenario focused on the interpretation of statistical graphs, including dotplots, histograms, boxplots, and case-value plots. The learning task guides teachers through the following steps:
- Solve the same statistical task a student attempted
- View and interpret eye-tracking data (gaze plots, heatmaps, and gaze videos) alongside the student’s response
- Predict what the student might have been thinking based on the response and gaze behavior
- View the student’s explanation with eye-tracking data and compare it with the prediction
- Evaluate the student’s solution
- Review a guided summary of the systematic error and underlying conceptual difficulty.
Part-task Practice
At the end of each vignette, participants complete a targeted task that focuses on a key sub-skill related to the featured systematic error. These part-task activities typically involve:
- Analyzing visual attention patterns from eye-tracking data
- Diagnosing the systematic error
- Reflecting on whether the same error might occur in a different context using the same type of graph
These short, focused exercises help participants consolidate core diagnostic skills and support transfer to real-life classroom situations.
Supportive Information
In each vignette, we provide content knowledge related to statistical graph interpretation. This includes:
- Definitions and purposes of key graph types: dotplots, histograms, boxplots, and case-value plots
- Examples showing how to interpret each type of graph in context
- Short explanations of what to look for and why a particular graph is useful
This information helps participants activate relevant knowledge during working on the eye-tracking vignette.
Procedural Information
In each vignette, participants are introduced to different types of eye-tracking data visualizations, including:
- Gaze videos
- Heatmaps
- Gaze plots
The descriptions of these data types are made available just in time; that is, when the eye-tracking data of a student appears, participants can choose to access the relevant information via a button. This design supports interpretation by providing guidance exactly when it is needed, without overloading the learner in advance.
References
Van Merriënboer, J. J. G. (2020). Graphical view on the four components [Infographic]. https://www.4cid.org
Van Merriënboer, J. J. G., Clark, R. E., & De Croock, M. B. M. (2002). Blueprints for complex learning: The 4C/ID-model. Educational Technology Research and Development, 50(2), 39–64. https://doi.org/10.1007/BF02504993
Van Merriënboer, J. J. G., & Kirschner, P. A. (2018). Ten steps to complex learning: A systematic approach to four-component instructional design (3rd ed.). Routledge.