Eye Teach Stats

First Look – Sample Vignettes with Eye-Tracking

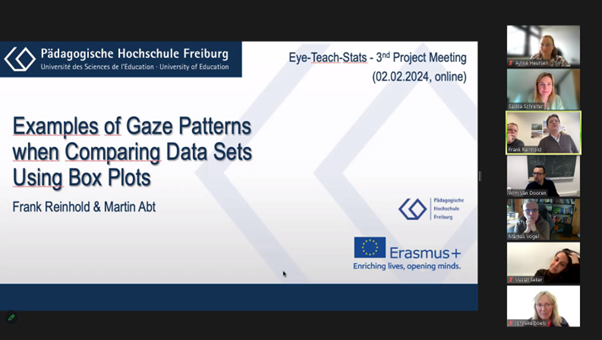
During our third project meeting, held online on February 2, we shared and discussed our very first vignette prototypes. These short learning modules combine real student responses with eye-tracking video, offering teachers a powerful window into how students approach graph interpretation tasks. It’s exciting to see our materials moving from research to practice—we can’t wait to test and refine them further!

ERASMUS+ RESEARCH PROJECT

Be part of the
Eye Teach Stats study

Interested in improving your understanding of students’ interpretation of statistical graphs? Take our free online professional development course and contribute to the Eye Teach Stats project.

~2.5 hours in total · Pretest, 10 vignettes & posttest · Voluntary & anonymous

Get started in your language

Scroll to Top