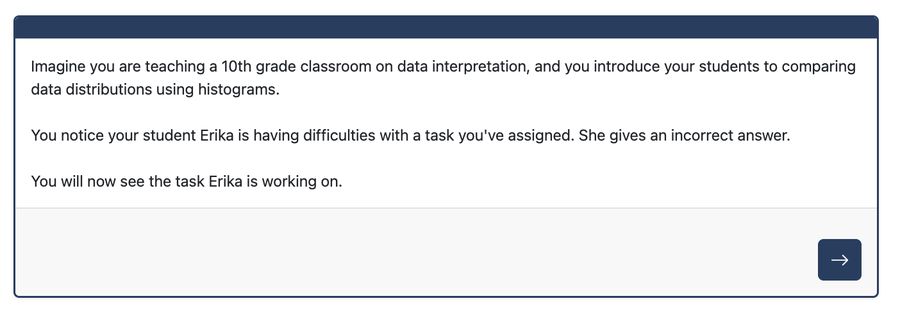
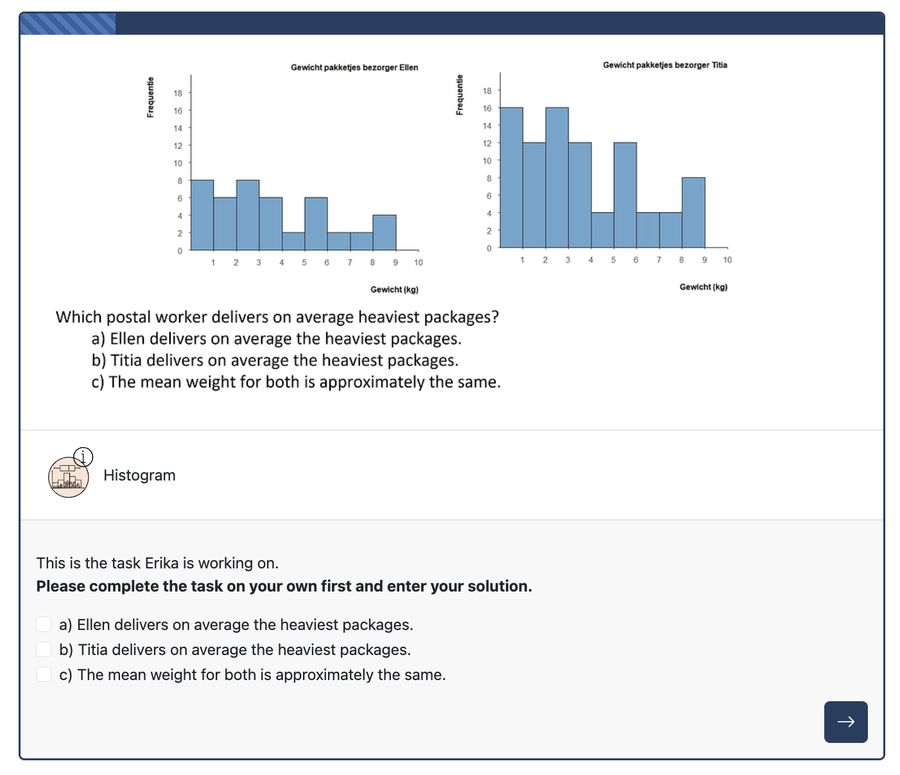
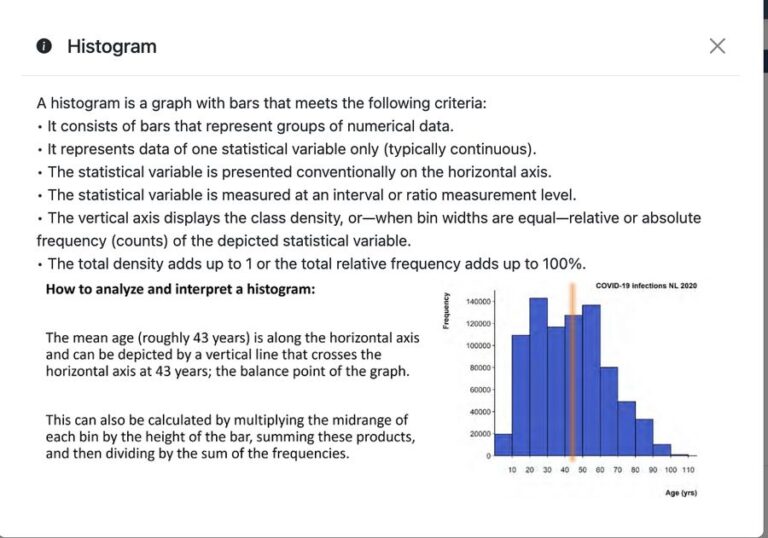
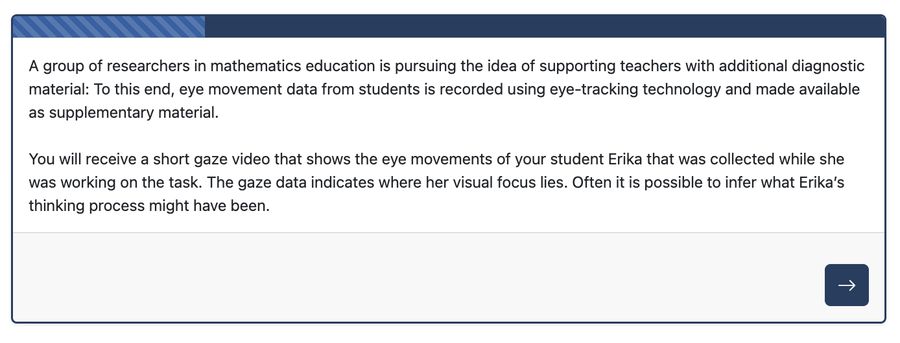
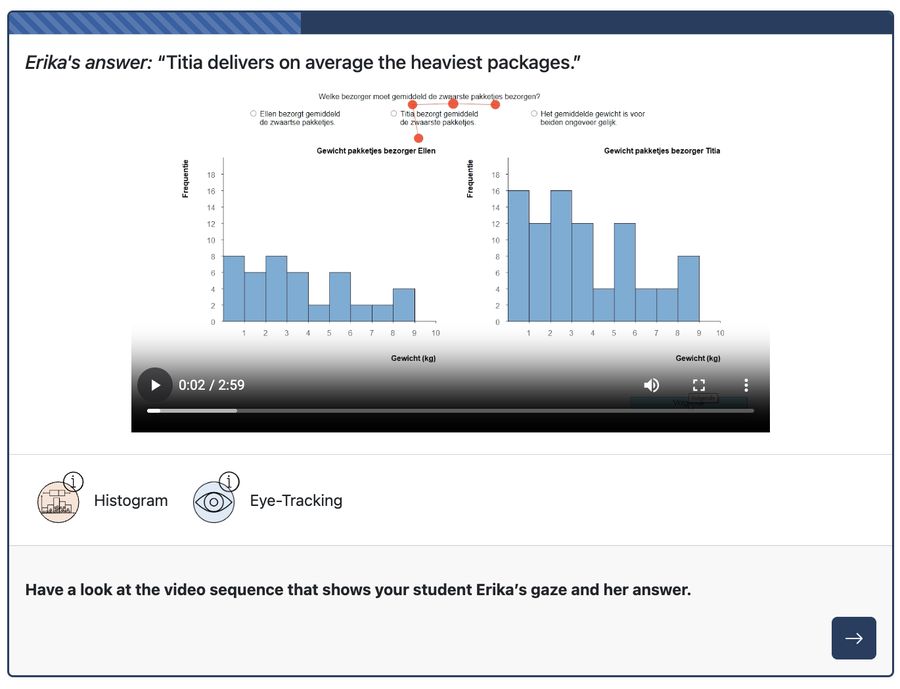
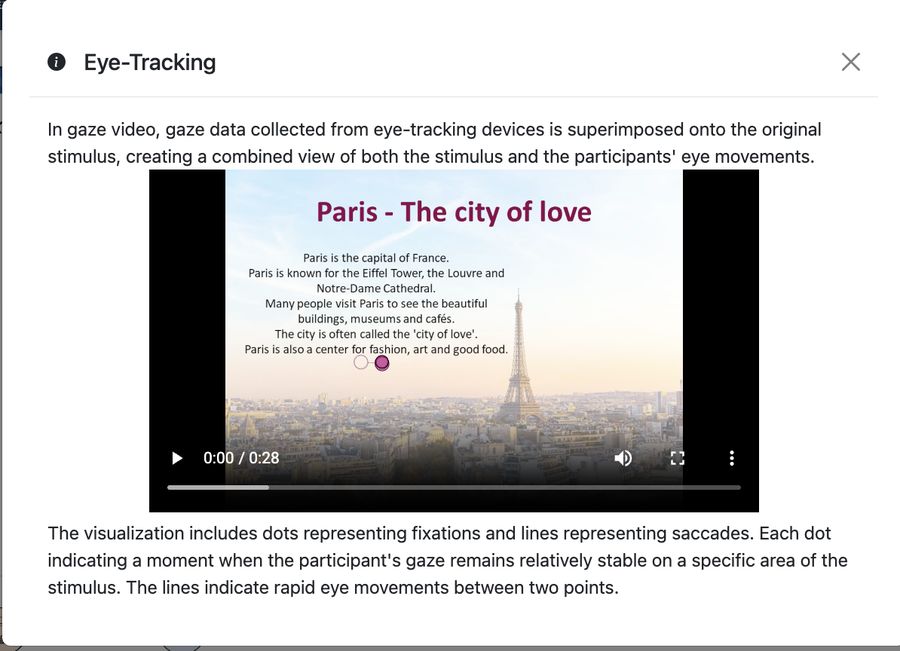
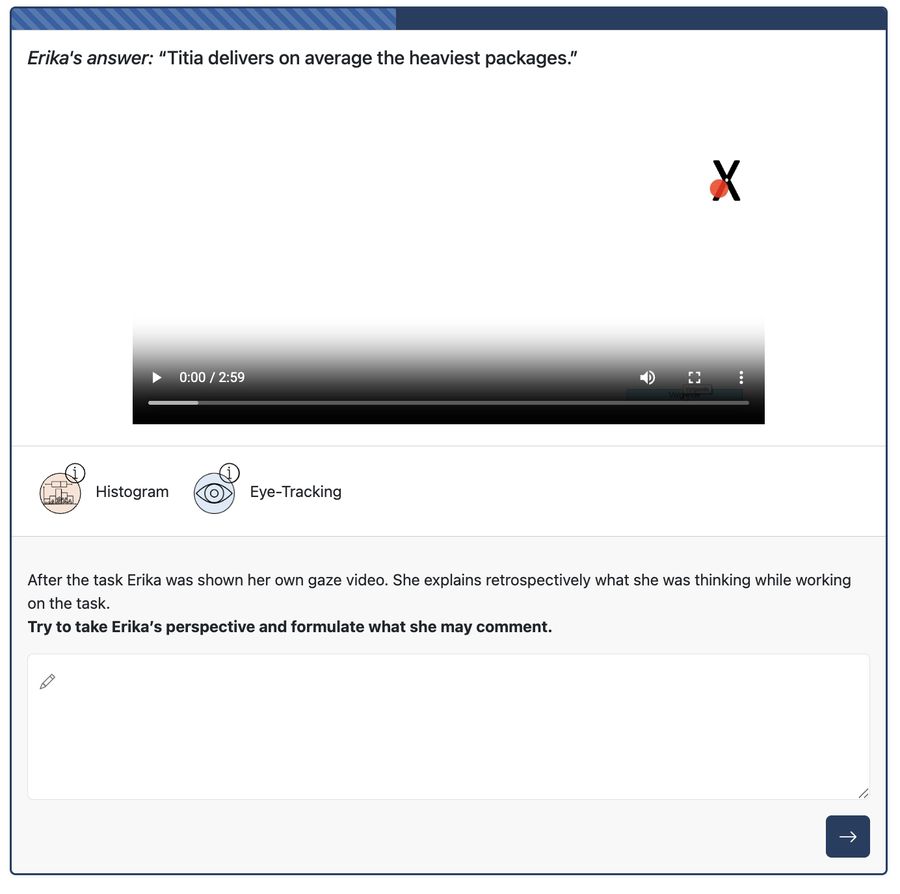
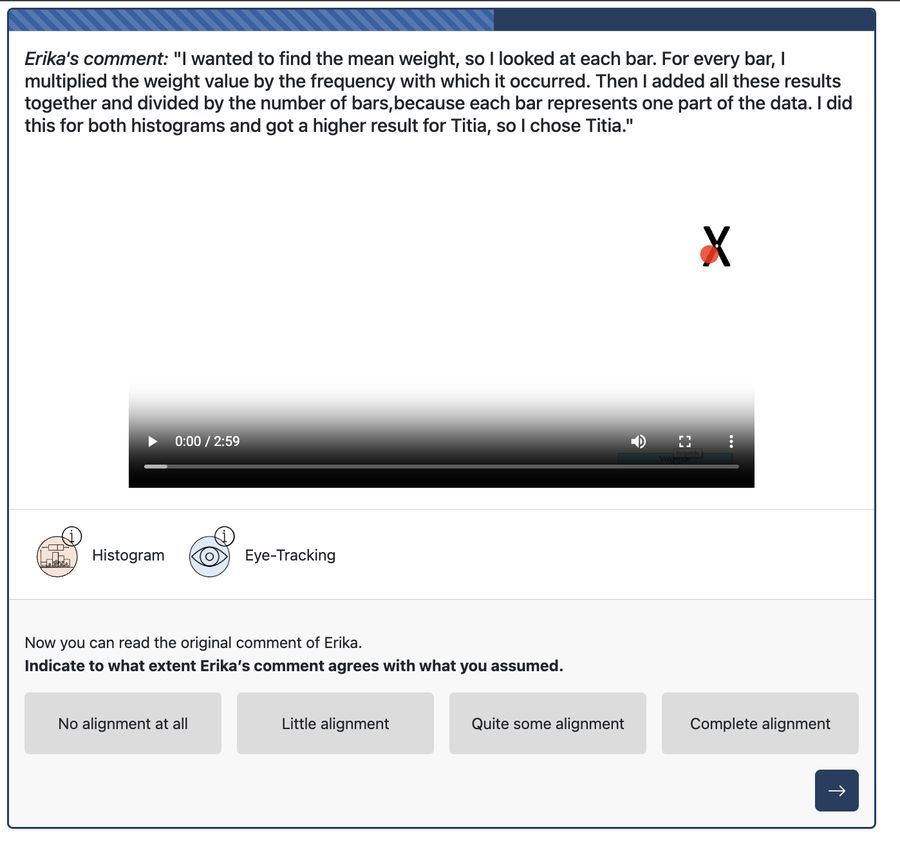
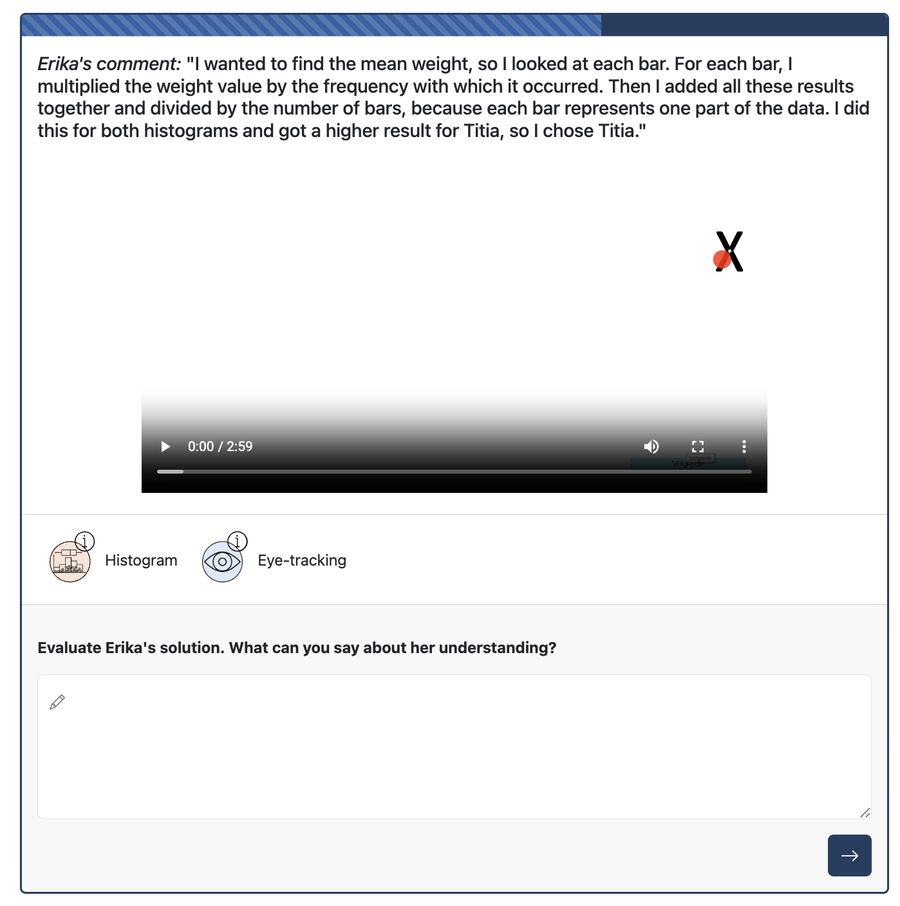
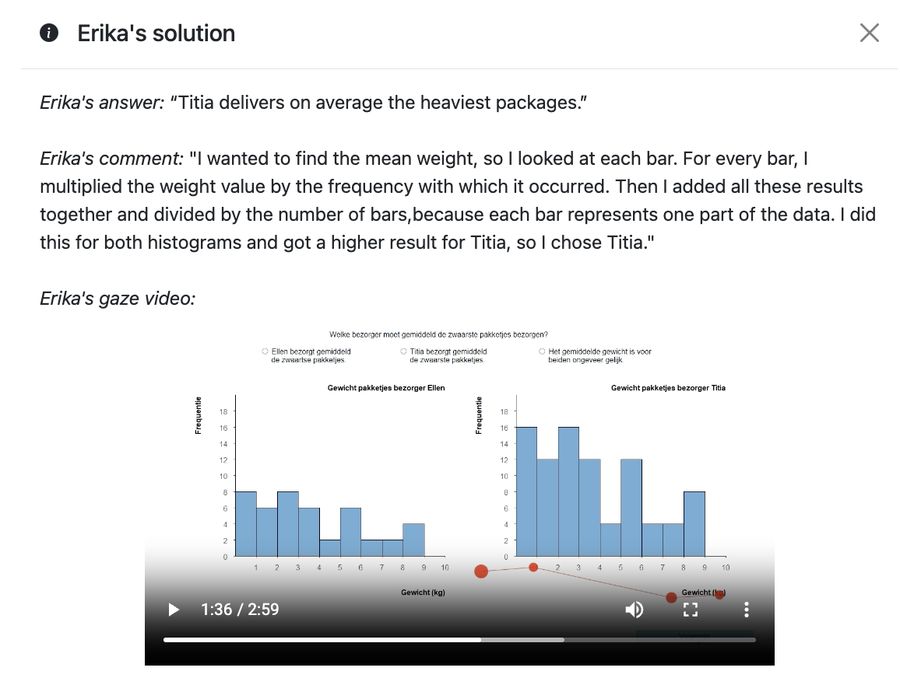
An eye-tracking vignette is a short scene from a real classroom situation: a student works on a graph task. You see the task, the student’s answer (often with a short explanation), and a visualisation of where the student looked while working on it.
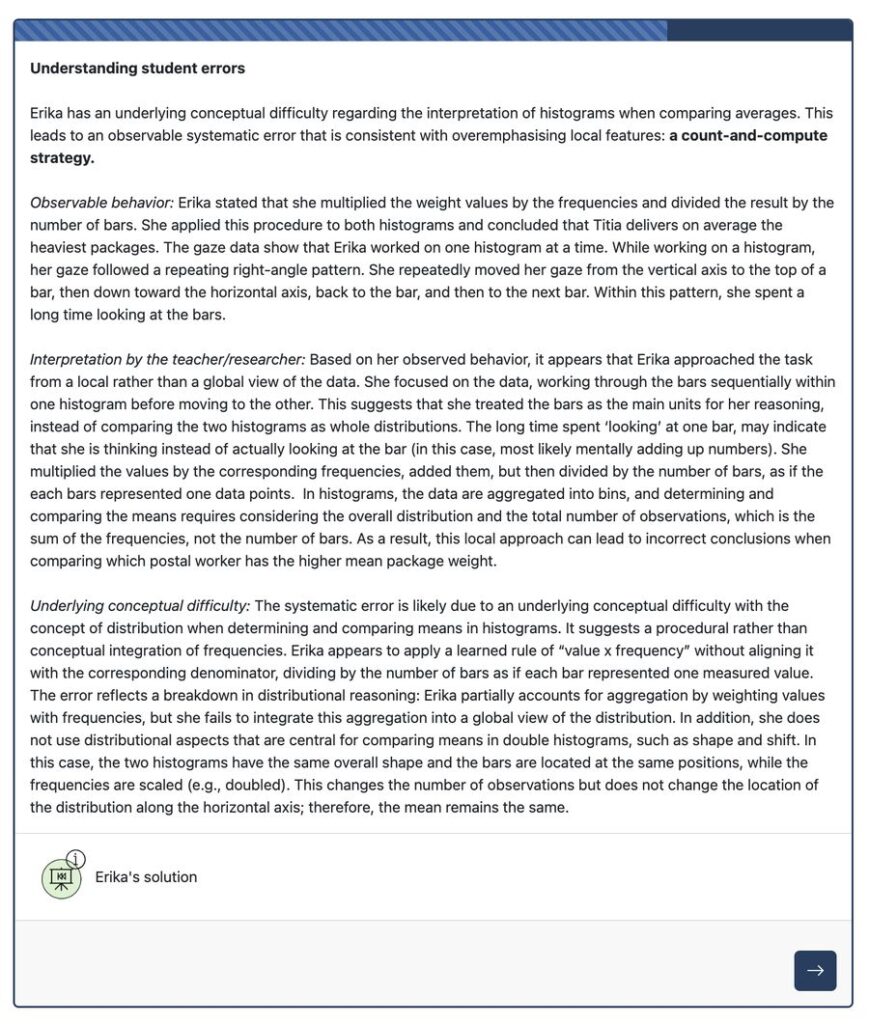
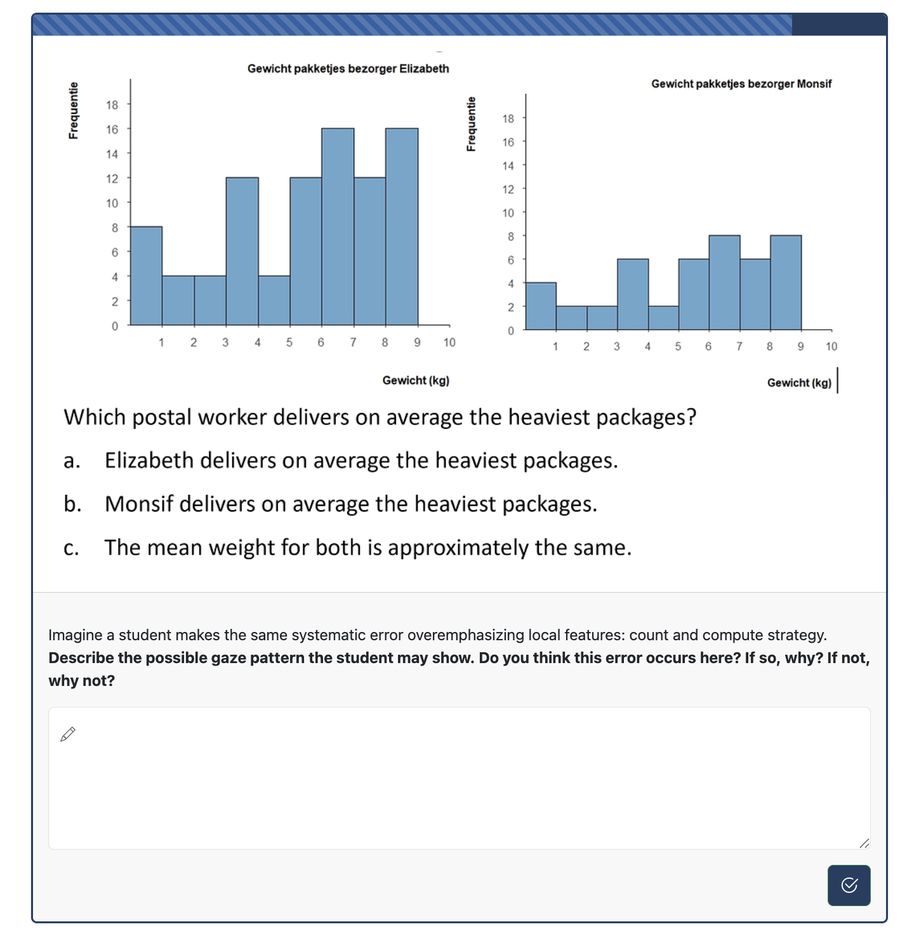
Your task is to work out how the student approached the graph. Where did they look, in what order and for how long? What might they have been thinking? The vignettes are based on real student data and focus on systematic errors in interpreting dotplots, histograms, boxplots and case-value plots.
Work through the vignettes
The vignettes are on MaMpf (Mathematical Media Platform), a free, open-source e-learning platform of the Institute for Mathematics at Heidelberg University. Registration is free and you do not need a university e-mail address. The MaMpf interface is in English and German. The vignette course itself is available in English, Dutch and German.